|
Triggers: interactive charts
Logic: shows you how to use PowerPoint's Triggers for
interactivity
Note: there is also a hyperlink demo of this
here
This is where we are going, an interactive chart that responds via Triggers.
Note, this is not easy. You should have been at PowerPoint Live!
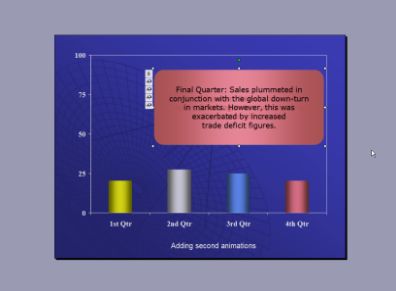
A trigger results in an animation sequence, or a sound or movie playing when an
object is clicked. Our example is an interactive, Clustered Column chart that
will respond to a user who clicks on any chart bar. A text box will enter,
containing information about the data for that category. A different animation
will result from a click on either of the four category bars.
The steps in building this slide are:
1. Format the chart and ungroup it into various objects,
2. Insert and animate the text boxes that will be the response to the trigger,
3. Add the triggers,
4. Identify further complications, such as any Exit animations,
5. Continue to build the rest of the slide.
We change the Slide Layout to hold a chart.
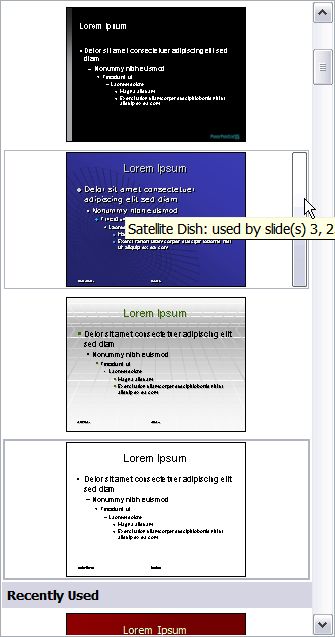
We add a Design Template.
We change the Color Scheme, if we desire.
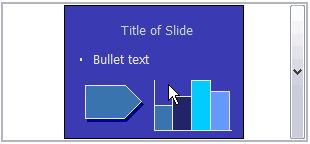
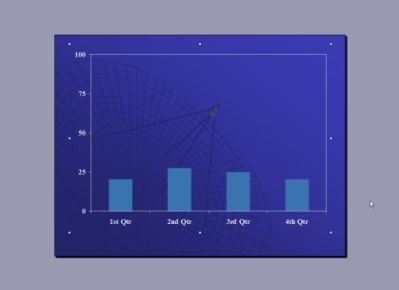
We add the chart and format it. That is, we format the chart to
get rid of any details we don’t really need. We want our final slide to be as
uncomplicated as possible. This includes getting rid of excess gridlines and
selecting appropriate axis scales.
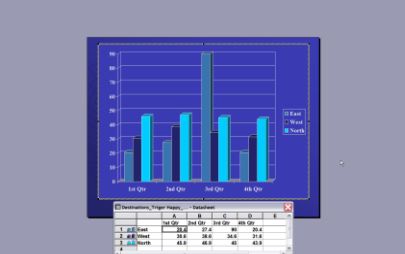
From this above, to this below!
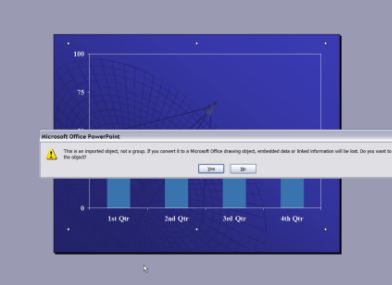
We then ungroup the chart twice (Right Click, Grouping, Ungroup)
and are ready to animate. Remember that ungrouping a chart will result in a loss
of data from the data sheet.
Now to format bars and add text boxes. The real trick is
to color elements we will animate together.
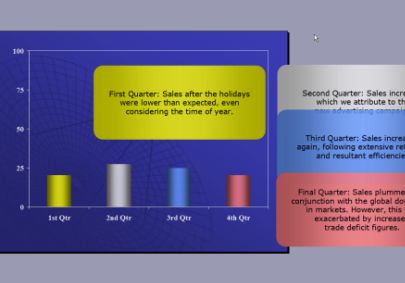
Now, when we click the yellow bar, the yellow text box will
animate in. Same for the grey, blue and pink bars. Colors help us follow what we
are animating. Now something tricky that
no-one usually tells you. When we go to animate Triggers, there will be a huge
amount of objects to select from. We get around this by selecting all objects
(everything except the colored bars and text boxes) and GROUP them. That will
mean only ONE entry for the things we don't want to animate. Cool? We then
animate our yellow text box to come in via Fade.

Now, to animate the first Trigger. Our yellow text box will need to fire when we click the yellow bar. To
add the Trigger, we select all animations that we want to result from the
Trigger (note that we only have one animation so far in this example). When the
animation or animations are selected in the animation Task Pane, we hit the
<Enter> key to bring up the Effect Options dialogue box.
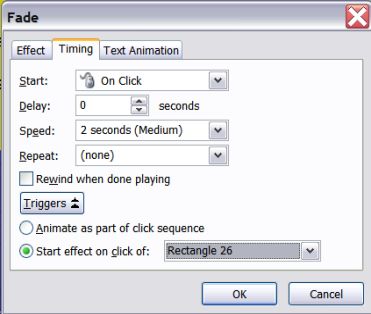
In the animations Timing tab, we click “Triggers” and “Start effect on click
of”. We select “Rectangle 26”, which is the name of the bar on the slide we want
to click on.
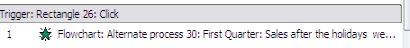
We now have the text box appear after the “Rectangle 26” trigger in the
animation pane. We continue to add and animate text boxes, adding Triggers as
appropriate. That is, we animate the yellow box in when we click on Rectangle 26
(Yellow Bar).
After all text boxes enter when the appropriate bar is clicked, we then look for
any complications.
Complications
We currently have text boxes fading in on a mouse click. But if we then click on
a second category, we will want any text box not associated with that category
to go away. Using the example of the yellow bar, we build exit animations (Fade)
for the grey, blue and red text boxes, and have the Exits Animations Triggered
when the user clicks on the yellow bar. In plain English, we animate Exits for
our 3 bars and drag those animations to the Trigger of rectangle 26.

See. One comes in and 3 go out. (Ignore "j0400417.jpg as
that is a separate image).
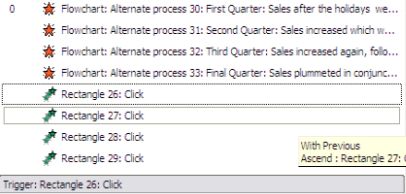
At this stage, we can click on the yellow bar and have
the yellow box animate in and any other color boxes animate out, if they
already appear in the slide. We now do the same for grey, blue and pink
bars. Remember, you want the associated color box to come in, and all
other 3 to go out.
| Click Yellow |
Yellow box in |
Grey, blue and pink out |
| Click Grey |
Grey box in |
Blue, pink and yellow out |
| Click Blue |
Blue box in |
Pink, yellow and grey out |
| Click Pink |
Pink box in |
Yellow, grey and blue out |
At this stage, all animations for triggers are done. But
when we first load the slide, we have one last thing to do. We need all
four bars to animate in (done in the example with "Ascend"). Also, we
want all four boxes to disappear (done at the start with "Disappear").
Here are the four bars animated in and the four boxes
animated out, right at the start. Notice they are at the top of the
timeline before any other animations that are all triggered.
If you have read to this point, you deserve the example!
Download Trigger Example
|